
Page History
...
- Log in to ProTrack Warehouse.
Select Ad Hoc Reporting under the Reports menu. The Ad Hoc Reporting screen appears.

Fig.1 Ad Hoc ReportingAd Hoc Tab Descriptions
Tab
Description
Basic
Displays detailed information about the ad hoc report.
Group
Contains the filtering and grouping criteria of the ad hoc report.
Metrics
Displays which metrics will be shown on the ad hoc report.
Table 1. Ad Hoc Tab Descriptions
Info title Info - ProTrack Warehouse comes preconfigured with all of the previously-available Performance/Cost Reports, but in the Ad-Hoc format. The user may now opt to use either Analysis > Performance/Cost reports module or the new Ad Hoc Reporting module to run these "pre-canned" reports and/or modify them and save them as a Report Profile for later use.
Basic
On this tab the user selects the report's basic information options, including the report title, date range, and format.
Basic Field Description
Field | Description |
|---|---|
Report Title | The title that is printed at the top of the report. This does not need to be unique; neither for a single user, nor across multiple users. |
Baseline | Select whether performance values are reported in either 0% or 100% baseline. |
Sort | Select whether to sort the report by Columns (left most column of metrics in ascending or descending order) or to sort by Groups (first column alphabetized A to Z). |
From Date | Specify the start date of the date range to be included in the report. |
To Date | Specify the end date of the date range to be included in the report. |
Table 17. Basic Field Descriptions
Group
On this tab the user filters and groups the data. 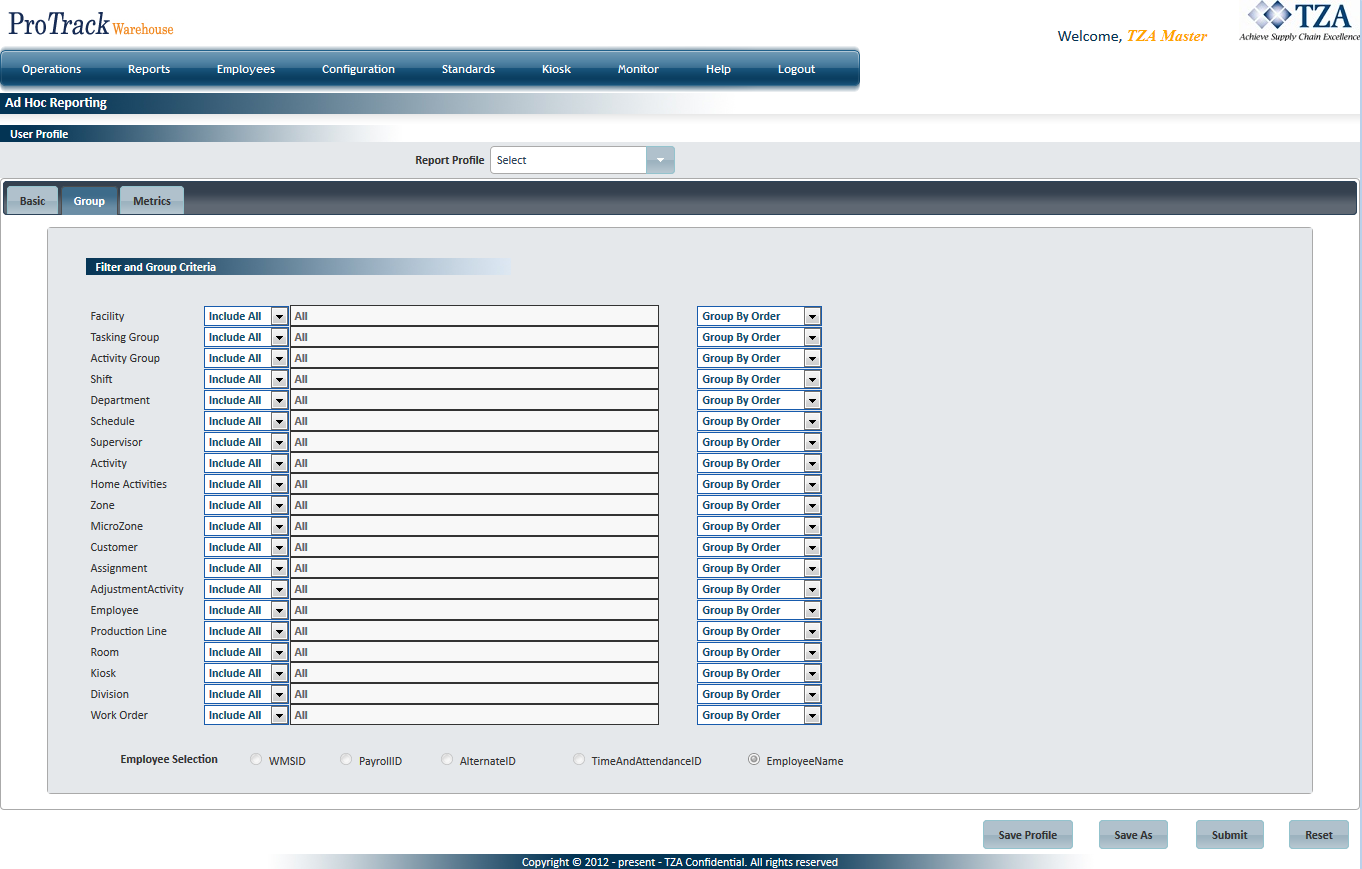
Fig.2 Ad Hoc Reporting - Group
Data can be filtered and grouped by any of the following:
...
An example to summarize this tab is shown below. Here the user has chosen the grouping hierarchy to be 1) Activity Group, 2) Activity, 3) Facility, 4) Employee. The user has also opted to display the detailed employee information, identifying employees by WMS ID. 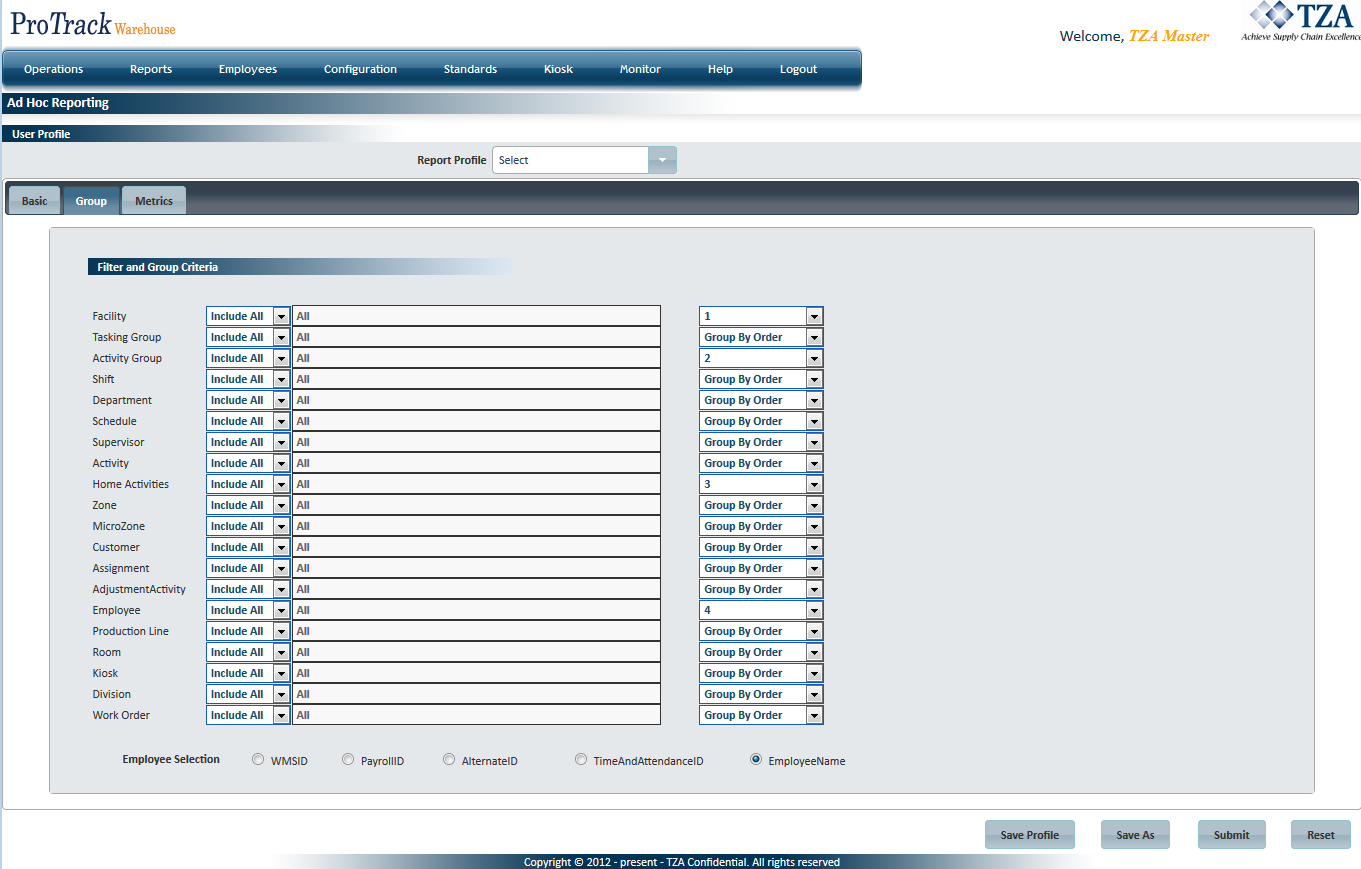
Fig.3 Ad Hoc Reporting - Group Example
Metrics
On this tab the user selects the various reporting metrics to be included on the report and optionally applies any additional filtering criteria to the selected metrics.
...
Click
to add the desired metrics. Each metric will be added as a column on the report.

Fig.4 Ad Hoc Reporting - Performance MetricsSelect a Criteria from the drop down list.
Info title Info Listed below are the available Performance metrics:
- Total Time
- Break / Lunch Hours
- Delay Hours
- Indirect Hours
- Actual Time on Standard
- Standard Time Earned
- Adjusted Standard Time
- Actual Performance
- Total Performance
- Adjusted Performance
- Effectiveness
- Utilization
- Actual Cost ($) – employees' payrates × total time
- Standard Cost ($) – employees' payrates × standard times earned
- Adjusted Cost ($) – employees' payrates × adjusted standard times earned
- Total Kits - With Manufacturing Module
- Total Totes - With Manufacturing Module
- Total Components - With Manufacturing Module
- Down Time Occurrences - With Manufacturing Module
- Total Down Time - With Manufacturing Module
- Total People Assigned - With Manufacturing Module
- The next 5 columns are used to filter the data presented in the selected metric (if desired).
Comparator1 – a mathematical operator used in conjunction with the field to the right ("Value").
Info title Info Available comparators are:
- > (greater than)
- < (less than)
- = (equal to)
- <= (less than or equal to)
- >= (greater than or equal to)
- "–" is simply a placeholder meaning nothing is selected. It is not a subtraction sign.
- Value – used in conjunction with Comparator1. Enter a numeric value to constrain the data. For example if Comparator1 is set to "<" and "5" is typed into the Value field, only data which are less than 5 will be displayed on the report.
- Logical Operator: "AND", "OR". Use this column to join the previous two columns with an additional comparator and value in the next two columns.
- Comparator2 - an additional comparator.
- Value – used in conjunction with Comparator2.
- The next column is used to sort the data. Data can be sorted in either ascending or descending order.
- Select the order number of each metric. This is the column number in which the metric will appear. Columns appear left-to-right with number 1 being on the far left.
- If "Sort by Columns" was selected on the Basic screen, all reported data will first be sorted by the column on the far left (having an Order Number of "1"), and then by the second column, then third, etc… Thus it is important to place the column by which you want the data sorted on the far left (Order Number = 1). If "Sort by Groups" was selected on the Basic screen, the Sort option here has no effect.
- At the minimum, for each Metric that is added, a Criteria and Order Number must be selected. All comparators are optional.
- Click
- Once all of the metrics have been added, the report can either simply be run by clicking
Click
 and a popup window appears.
Fig.5 Ad Hoc Reporting - Save Profile- Type in a name for the report profile. Report Profile names MUST be unique across all users.
- If the profile was already previously saved, clicking
- Alternatively, if an existing profile has been edited, but you want to keep the original profile settings too, click button to bring up the Profile Name popup and save the Report Profile as a new name.
Click

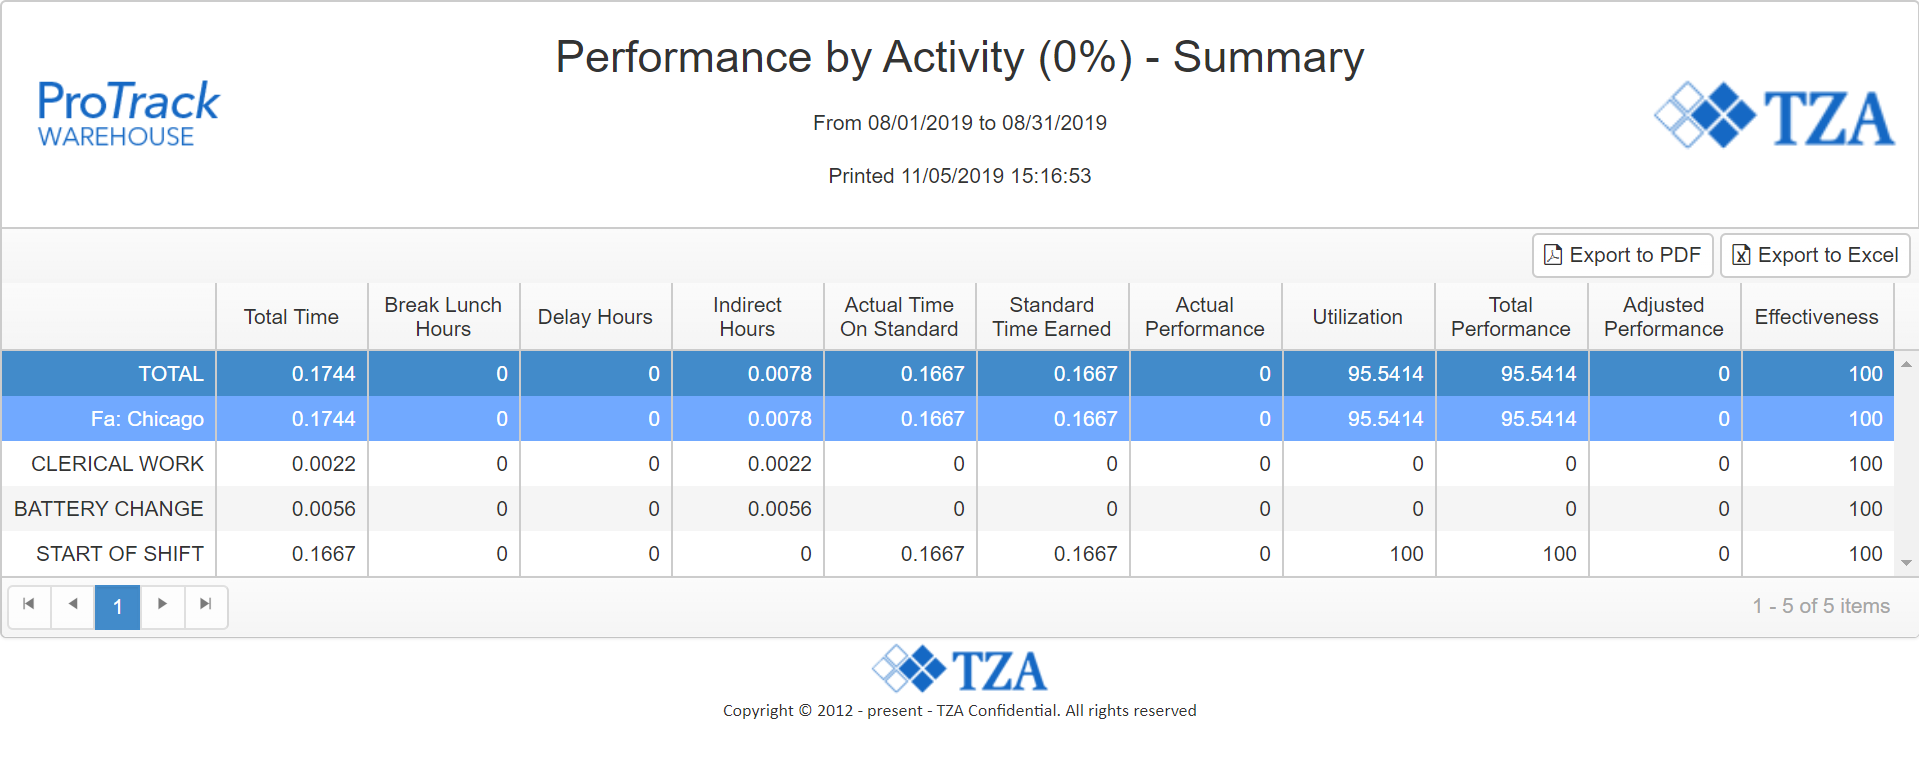
Fig.6 Ad Hoc ReportingNote title Caution - Grand Total will be shown as the first row on the first page instead of the last row on the last page.
- Sub-Total will now be listed as the first row when a new grouping is presented. For example, Fig.122 shows the employee sub-total as the first row and the values that sum up to that total are listed underneath.
From there, the report can either be exported to a variety of formats by clicking


 .
.Info title Info Available export formats include:
- Adobe Reader (.pdf)
- HTML
- Microsoft Excel (.xls)
- Text (.txt)
- Rich Text Format (.rtf)XML
- To print the report, click
 . The report will be generated in PDF format first and from there the report can be printed.
Overview
Content Tools