Documentation for ProTrack Warehouse 7.5.
The Ad Hoc Reporting screen enables a user to create completely customizable reports on both performance and quality-related data. The user can specify which reporting metrics to include, in what order they appear, and can apply constraints to limit the data presented. The user also has full control over how data is grouped and totaled.
The Ad Hoc Reporting framework also reports on Utilization and Effectiveness a little differently than the reports in the Performance-Cost Reports tab. With an Ad Hoc report, you can accurately report on utilization and effectiveness at ALL grouping levels. This is accomplished by factoring in any and all adjustment assignments in parent groupings. In other words, running an ad-hoc report with groupings 1) Employee, 2) Activity will list activities with times in both the "time on standard" and "delay", "indirect", or "break/lunch" columns. This indicates that an employee was in a standard activity and had a delay, indirect, or break/lunch occur WITHIN that activity.
For example, if an employee spends 1 hour in activity "Pick", but 10 minutes of that was actually spent in a delay, the ad-hoc report would display, for "Pick" :
Total Time: 60 mins
Time on Standard: 50 mins
Delay Time: 10 mins
Standard Time: 52 mins
Performance (for "Pick") = (52 / 50) - 1 = +4%
As a result of this, delays and indirects that are adjustments shall no longer be listed in their own activity grouping (as these times will be reported under the parent activities in which they occurred). As such, parent-level indirects will be grouped when grouping by "Activity", and child-level (adjustment) activities will be grouped when grouping by "AdjActivity".
To access the Ad Hoc Reporting screen:
- Log in to ProTrack Warehouse.
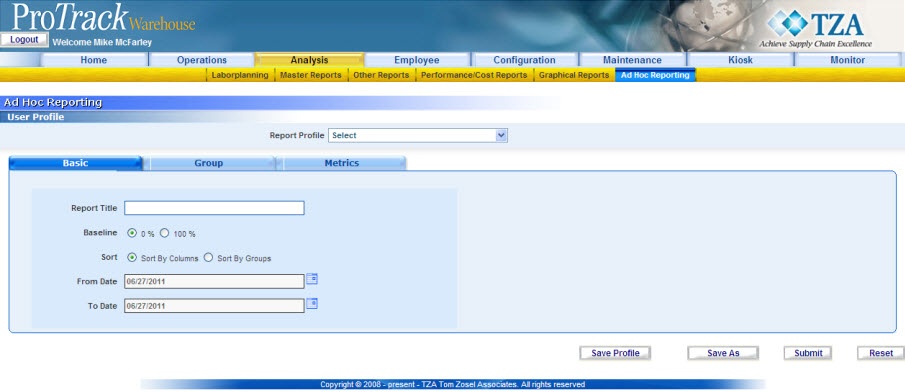
- Select the Ad Hoc Reporting tab under the Analysis menu. The Ad Hoc Reporting screen appears.

Fig.372 Ad Hoc Reporting
Ad Hoc Tab DescriptionsTable 86. Ad Hoc Tab DescriptionsTab
Description
Basic
Displays detailed information about the ad hoc report.
Group
Contains the filtering and grouping criteria of the ad hoc report.
Metrics
Displays which metrics will be shown on the ad hoc report.
Info
- ProTrack Warehouse comes preconfigured with all of the previously-available Performance/Cost Reports, but in the Ad-Hoc format. The user may now opt to use either Analysis > Performance/Cost reports module or the new Ad Hoc Reporting module to run these "pre-canned" reports and/or modify them and save them as a Report Profile for later use.
Basic
On this tab the user selects the report's basic information options, including the report title, date range, and format.
Basic Field Description
Field |
Description |
|---|---|
Report Title |
The title that is printed at the top of the report. This does not need to be unique; neither for a single user, nor across multiple users. |
Baseline |
Select whether performance values are reported in either 0% or 100% baseline. |
Sort |
Select whether to sort the report by Columns (left most column of metrics in ascending or descending order) or to sort by Groups (first column alphabetized A to Z). |
From Date |
Specify the start date of the date range to be included in the report. |
To Date |
Specify the end date of the date range to be included in the report. |
Group
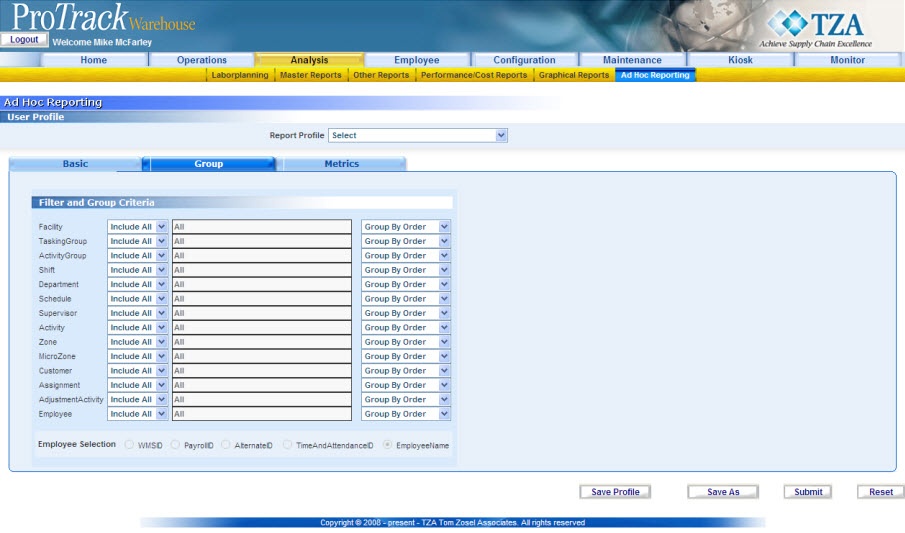
On this tab the user filters and groups the data.

Fig.373 Ad Hoc Reporting - Group
Data can be filtered and grouped by any of the following:
- Facility
- Tasking Group
- Activity Group
- Shift
- Department
- Schedule
- Supervisor
- Activity
- Zone
- Microzone
- Customer
- Employee
- Next to each of the items listed above, in the drop-down field on the left, choose whether or not to filter the data. By default, each is set to Include All data.
- Using the drop-down field, choose to Include or Exclude to filter specific values. When either is chosen, a spy-glass button appears to the right of the second field. Click here to specify particular values to either include or exclude. For example selecting to include the activities "Pick" and "Putaway" and excluding the Shift "First Shift" will result in all records for picking and putaway for employees not on first shift.
- After specific selections have been made, the user can reset back to "All" by clicking in the drop-down list and choosing "Include All".
- Use the "Group By Order" drop downs on the far right to summarize the data. Use these numbers to select which fields to group by, and the order to do so. The highest level of data summarization will be determined by the "Group by Order" with the lowest numerical value (1). The data will then be separated by the next lowest "Group by Order" value (2). This will repeat for as many of the "Group by Order" values that are selected. The largest group by value will be displayed as the detail portion of the report
- 1) Facility
2) Shift
3) Employee
Info
- A minimum of one "Group by Order" must be selected. The maximum number of groupings is 5.
- If Employee is chosen to as a grouping, then the user must select the employee id that will be displayed on the report. The user id will default to the WMS employee id. The available values include:
- Last Name, First Name
- WMS id
- Time Attendance id
- Payroll id
- Alternate ID
- 1) Facility
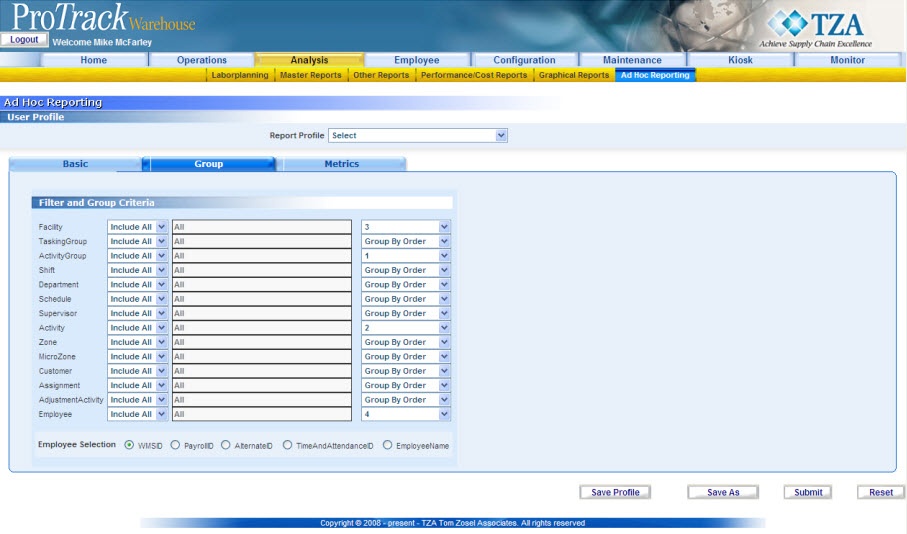
An example to summarize this tab is shown below. Here the user has chosen the grouping hierarchy to be 1) Activity Group, 2) Activity, 3) Facility, 4) Employee. The user has also opted to display the detailed employee information, identifying employees by WMS ID.

Fig.374 Ad Hoc Reporting - Group Example